How We Used Advanced Analytics to Uncover Anomalies in Energy Plant Dataset

In the fall of 2020, our Lumada Solution Engineering team hosted a three-month fellowship program to enable top young talent in data science, AI, and big data to collaborate with the Hitachi Vantara team on customer challenges and innovative projects. Three fellows were chosen out of a pool of more than 500 applicants; each fellow was selected for their academic excellence, intellectual curiosity, and communication skills. Meet the fellows below.
In this blog, Lumada fellow Pinhang Zhao describes the team’s project: to address a customer use case and demonstrate how the Lumada platform could help orchestrate and automate machine learning and analytics.
We live in a world where machines and technologies support nearly all facets of our lives; we enjoy the convenient supply of water, electricity, gas as well as internet services to our homes and buildings without having to worry about their continuity. But how is this continuity ensured?
Oftentimes, it comes down to properly processing – and understanding – data. Data has the power to tell stories; but only those equipped with the right tools can interpret them.
In the process of analyzing an energy plant’s equipment readings, our team discovered unusual data entries that offered warning signals about the plant’s operations.
Here’s the story of how we developed an anomaly detection system for an energy plant to ensure smooth operations for the company and a continuous energy supply for its customers.
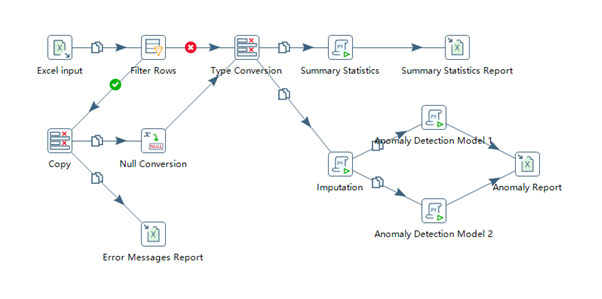
We started by processing the plant’s dataset. The equipment readings had dozens of columns and thousands of rows, each indicating a set of readings taken from different components and machines at hourly intervals.
While most of the rows had quite clean readings, around 20% of them showed at least one warning signal, including a noticeable number of rows showing only warning signals due to system failures. Warning signals were presented as strings of text containing specific error messages, which we then converted to null, and imputed them for later use.
The rows with warning signals would be imputed for two reasons: (1) because of the missing readings in the corresponding columns, and (2) because they could provide insight about which part of the system was malfunctioning. In this way, the presence of warnings proved both challenging and insightful.
We found ourselves asking: “Are outliers anomalies? Are they the things we are looking for?”
The complex nature of this dataset prevented us from interpreting it traditionally and simply. To gain more insight, we carried on with the help of additional techniques and algorithms.
By applying a simple summary statistics function, we were able to get familiar with values in every column of the dataset. Sometimes, simple calculations on the simple statistics yielded excellent results. For example, using mean, min, median and max, we found the skewness of a column and determined if min or max was ‘common’ (appeared frequently).
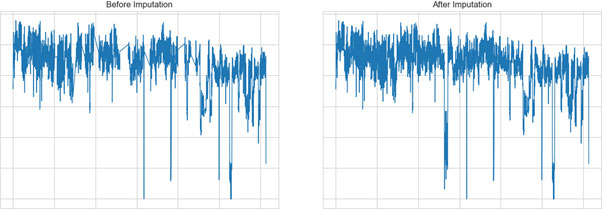
Before our next step, imputation, we set out to clean-up the dataset. We dropped all rows that had warning signals in almost all columns. In order to properly detect unusual values (anomalies), we had to impute these entries as they were missing numerical values.
‘Imputation’ simply means filling the blanks with characteristics that they should have. There are plenty of methods to fill these missing values, but we considered a few different factors in order to choose the right one.
First, no one knew the ground truth, and therefore any single method would be acceptable (we do not need to use different methods and compare them). Second, since our dataset was a multivariate time series, univariate imputation would not be suitable. Third, there came the famous ‘machine learning’ dilemma – the stability-plasticity dilemma: while trying to make the best guess possible based on those entries that were not missing, retaining some ‘originality’ was also desired. This is especially important in anomaly detection since the job is to find generally incorrect values.
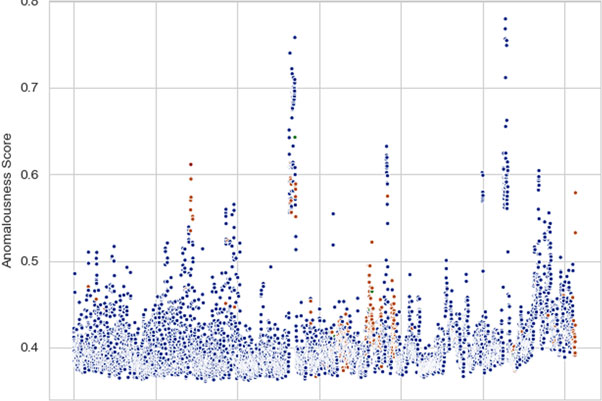
At this point, we’re ready to implement anomaly detection algorithms to find the unusual data. We selected a few off-the-shelf algorithms (Isolation Forests, One-Class SVM, and Local Outlier Factor) and obtained a set of results which complemented each other.
Unlike imputation, anomaly detection with various algorithms has its benefits: when algorithms agree with each other on predictions of anomalies, it makes these predictions more credible; when algorithms do not agree with each other, it escalates the situation, informing us that there may be something the algorithms did not understand, and that we should investigate further from a human perspective.
Since the job was to find unknown unusual values, which was an unsupervised learning task, we did not have much room to tune hyperparameters, and we continued with some default and popular settings.
In a business fashion, we quickly organized our plans and structures, applied these machine learning techniques, and compared our results with ‘common sense.’ Apart from convincing clients with concrete knowledge and solid methods, we wanted to make sure the clients trusted our results from their points of view; that’s where this comparison with common sense comes in.
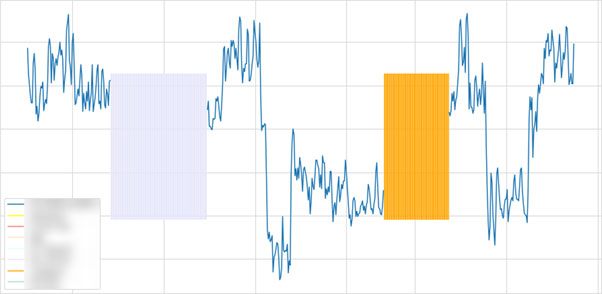
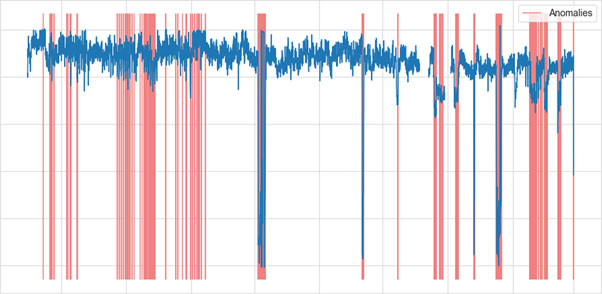
Plotting raw data with the detected anomalies highlighted is a straightforward way to illustrate to clients why they should believe the results. There were cases where detection was not in line with raw data, which was acceptable because no one could guarantee that results were 100% correct nor anomalies were 100% found. We would analyze with the results, not purely on the results. And finally, we combined all we had learned with our judgements to articulate our findings and suggestions to the client.
The good news is our clients can set up this whole process easily with Lumada Data Integration. Lumada allows clients to perform data ETL (extract, transform, and load) from various sources and formats integrated with different databases. It also enables machine learning modeling and evaluation with different supported coding languages, on Transformations and Jobs. With Lumada, clients can automate and update their own workflows through its user-friendly graphical interface and expandable functionalities.
To learn more about Lumada Data Integration, visit us here.


Pinhang Zhao
Pinhang Zhao is a Mathematics student at Imperial College London approaching his final year. He has studied a few statistics and data science modules and became interested in data analysis, new technologies, and markets. Pinhang is truly passionate about mathematics and holds 4 UKMT Gold Awards. Pinhang is a keen learner and aims to deepen his expertise in data science, data engineering, and Big Data technologies. In his words: “Numbers are not fun, so I seek what’s behind numbers.”