Over the past several weeks, the term DataOps has reverberated throughout the walls of Hitachi Vantara offices around the world and soon it will take the spotlight at NEXT 2019, the world’s first smart conference. We’ve defined DataOps and how its changing the game by putting the right data into the hands of teams, when and where they need it most. We’ve also talked about Hitachi Vantara’s DataOps journey, Project Champagne. (You can access all of this content at our DataOps Advantage webpage.)
Now it’s officially time to put on our lab coats and geek out. That’s right, we’re going to talk about the data science behind this journey and for that I need to call on our top marketing science guru, Mike Foley.
Mike leads our new marketing science function, which brings the best of big data, machine learning and predictive analytics into our marketing team.
Jonathan: Mike, to say you joined Hitachi Vantara at THE perfect point in time is a massive understatement. As a company we’re introducing customers and Hitachi Vantara to our DataOps Advantage. Renée [Hitachi Vantara’s CIO] and I have talked about our Project Champagne journey and we’ve examined ways we can apply it within the marketing function. So, in partnership with IT, CTO and Sales Ops we have opened the curtain on our first use-case. We’re applying DataOps to better predict customer needs so our sales team can come to them with the solutions they need when they need it most. Sometimes even before the realize they need it.
The element we have yet to tell is the data science aspect behind it all. The “how.” Specifically, how do you come into a legacy company and implement this?
Mike: Thanks Jonathan. First off, you’re right, there could not be a better time to join this team. Hitachi Vantara is ahead of the game because we already have a proven solution and a DataOps methodology. This is in stark contrast to most businesses, which are looking to become an analytic competitor but A) cannot afford to bring on top-of-the-line data scientists and B) lack their own roadmap.
Hitachi Vantara is fortunate to have its own next-generation storage and middleware systems and so practitioners like me can work on the latest big data technology. We can eat our own dog food – or maybe drink our own champagne – and, in doing so, can find out what is working, and what isn’t.
Jonathan: That’s great. We take huge pride in using our own solutions. But having the solutions is one thing. How have we applied them to our business and in this case, marketing?
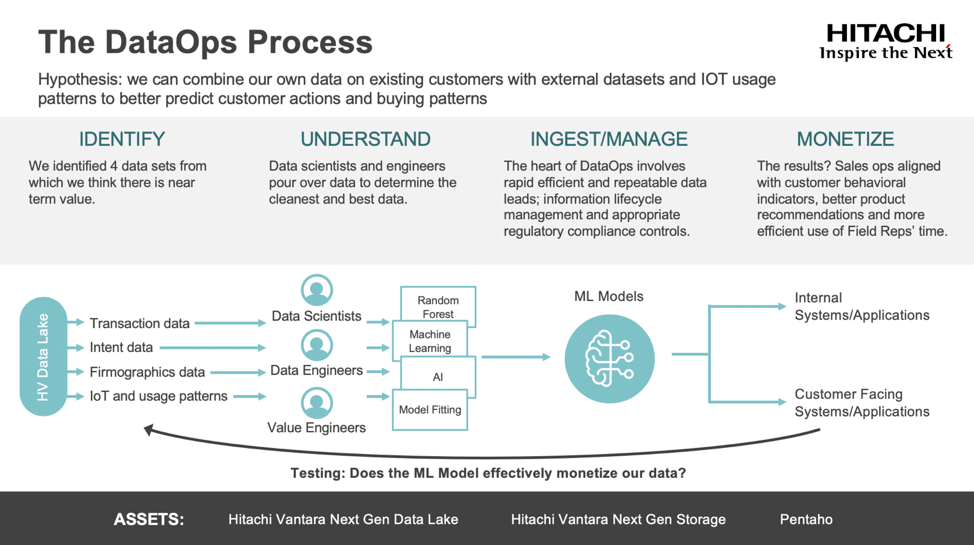
Mike: As is the case with many things in the science realm, we started with a question, “How can we combine our own customer data with external datasets (such as social media site traffic) and IoT usage patterns to better predict customer actions and buying patterns?” The next step was applying the methodologies that I touched on earlier.
Jonathan: Our DataOps methodology includes four parts—Identify, Understand, Ingest/Manage and Monetize. Can you walk us through each?
Mike: Of course. As you said the first step was to Identify the datasets. Here we first needed to understand the business problem and match up the potential data to provide a quantitative marketing solution. Next we focused on the data we believed would deliver near term value. For Project Champagne we came up with four: transaction data, intent data, firmographics data and IoT and usage patterns.
Jonathan: We selected these for very specific reasons. First off, the team wanted to make sure we gained the proverbial 360-degree marketing view of our customers and to do that we needed to get data from a lot of different sources. This included off-the-grid data, social media data (both on and off premises), IoT data, legacy data and much more. This was no easy task since this data is more diverse, distributed and dense than ever—the volume of social media and IoT data alone can be enormous.
Mike: That’s right. It’s a huge array of data with a massive range of dimensions or features. Sometimes we have to look at very large datasets that are sparsely populated with the data we need to make predictions. We may have to deal with missing or bad data too. It’s the data equivalent of looking for a small fish in the ocean. Or a needle in a haystack. So, while we collected a lot of data, we didn’t need it all in the end.
This is where Understand came in. In the science world we refer to this step as exploratory data analysis (EDA). Here our data scientists and engineers evaluated the relevancy and quality of the data. After all, you cannot use data if you don’t understand it. During this variable selection process, in some cases the data had to be changed to improve performance – features were combined into larger variables and data was transformed and normalized. This is called feature engineering and it’s a huge area in and of itself. In this instance, the techniques used during EDA included random forest, principal components analysis (PCA), exponential smoothing and normalization.
This led us to step three, Ingest and Model. This is where we got to the heart of DataOps and data science. Once the data was prepared, we built predictive models to generate high quality leads while working within the information lifecycle management framework and appropriate regulatory compliance controls.
Even at this point, we still had more data than any human could handle. We addressed that by testing a combination of statistical-learning and machine-learning techniques. For our team we came up with four options and used them to predict the propensity to buy, all with the goal of picking the one with the highest predictive accuracy. The four choices were:
- Support vector machine (machine learning)
- Logistic regression (statistical model)
- Classification tree (statistical model)
- Random forest (machine learning)
Ultimately, we chose a combination, or ensemble of several models. We used singular value decomposition (a type of collaboration filtering) to provide product recommendations in addition to likelihood of purchase. Then we employed a technique called survival analysis to predict time to purchase.
So, in the end, the ensemble of models gave us three critical insights at a customer level: purchase likelihood, product recommendations and purchase timing.
Jonathan: And this brings us to the fun part, monetize. Here we looked at the results with the goal of gleaning marketing insights for our sales team; the type that would align them with customer behavioral indicators and enable them to make better product recommendations and ultimately meet customer needs more effectively.
Mike: That’s right. DataOps is about making data actionable for the rest of your company. We are operating in a data democracy and the goal is to make it accessible to everyone.
Here the focus was on sales and customer insights and then putting the scored data into a portal to give our entire sales force the ability to quickly see which potential customers are highly likely to purchase a solution. But there’s more. We used a wide range of data – many dimensions that we did not necessarily use in the modeling process – to provide the 360-degree customer view and show what industry these customers were in, what have they purchased from us in the past, online behavior, who else they were working with and more.
Jonathan: With this type of insight the sales team can truly meet customer needs like never before. And at the same time this data can also help our marketing team replace any non-specific communications (goodbye to spam) with new levels of relevancy that hit at each and every customer touch point.
This DataOps journey has been incredible so far. We’ve come together as a team to examine where data can have the biggest impact on our business while applying data science to make it all happen. What’s even more exciting is that we are just at the beginning of this incredible journey. Stay tuned to hear more.